How Oil Shocks Rewire Economies: From the 1973 Crisis to Russia, Saudi Arabia and Venezuela
Crude price spikes do not just raise pump prices. They re-pattern fiscal politics, current accounts and central bank decisions for a decade.
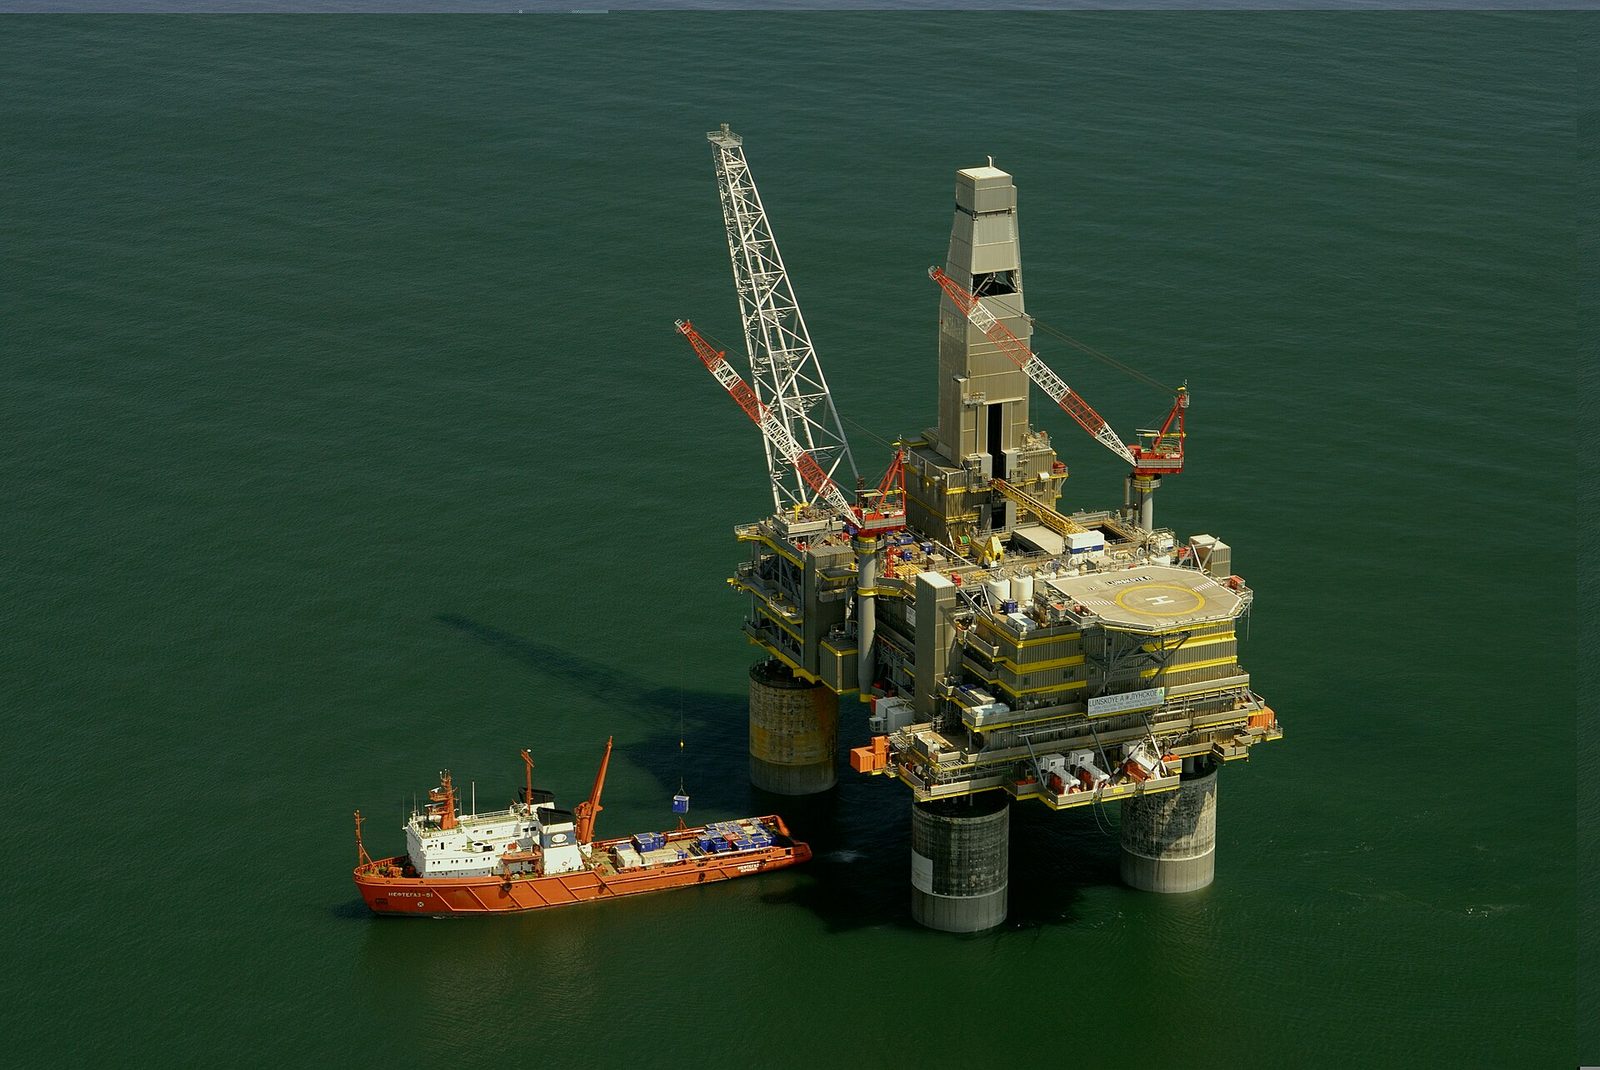
Crude price spikes are rarely self-contained events. The 1973 OPEC embargo did more than raise pump prices: it rewired the monetary system, fractured the Bretton Woods legacy, and pushed the United States, the United Kingdom, and Japan into a stagflation trap that persisted for nearly a decade. For petrostates, the mechanism is even more direct — oil revenue is not merely an export earner but the fiscal base itself. A sustained price move of 30% or more constitutes a monetary-shock-equivalent event in countries where oil accounts for over 90% of export receipts. The 1986 price collapse contributed to the Soviet Union’s fiscal unraveling; the 2014–2015 crash forced Russia to float the ruble and pushed Venezuela into an economic contraction that erased half of GDP. Saudi Arabia, by contrast, used its 2000s windfall to build a sovereign wealth fund and launch Vision 2030, a diversification attempt that remains unproven. Three case studies (1973, the Soviet/Russian trajectory, and Venezuela) illustrate how oil shocks rewire fiscal politics, current accounts, and central bank decisions for a decade or more.
Key takeaways
- The 1973 OPEC embargo triggered stagflation in advanced economies, with U.S. CPI inflation peaking at 12.3% in 1974 and unemployment rising to 9.0% by 1975.
- The 1986 oil price collapse reduced Soviet export revenue by roughly 40% in real terms between 1985 and 1988, contributing to the fiscal crisis that preceded the USSR’s dissolution.
- Russia’s 2014–2015 oil price crash forced a ruble float; the currency lost 46% of its value against the U.S. dollar between June 2014 and January 2015.
- Venezuela’s oil dependence reached 95% of total export revenue by 2013; the 2014–2019 price collapse coincided with a GDP contraction of approximately 50% (IMF, 2019).
- Saudi Arabia accumulated over $600 billion in sovereign wealth fund assets by 2023 (SWFI data), using 2000s windfall revenue to buffer against later price declines.
- Oil price moves of 30% or more in petrostates are fiscal shocks first, monetary shocks second: they alter government spending, exchange rate regimes, and inflation expectations simultaneously.
Historical setup
The 1973 oil shock did not emerge from a vacuum. By October 1973, the Bretton Woods system had effectively collapsed — the U.S. had suspended gold convertibility in August 1971, and the Smithsonian Agreement of December 1971 had failed to restore fixed exchange rates. The U.S. economy was already experiencing inflation above 5% when OPEC’s Arab members imposed an embargo following the Yom Kippur War. The price of crude rose from roughly $3 per barrel in 1972 to nearly $12 per barrel by early 1974 — a 300% increase in nominal terms.
For importing economies, the shock was transmitted through two channels. First, the direct cost of petroleum imports surged, worsening current account balances. The U.S. trade balance swung from a surplus of $0.4 billion in 1970 to a deficit of $4.7 billion in 1974. Second, the price increase was passed through to industrial inputs, raising production costs across manufacturing sectors. Central banks faced a dilemma: raising interest rates to combat inflation would deepen unemployment, while keeping rates low would entrench price expectations. The result was stagflation — a combination of high inflation and high unemployment that standard Keynesian demand-management tools struggled to address.
The Soviet Union, by contrast, was a net oil exporter. The 1973 price rise delivered a windfall that masked deeper structural problems. Soviet oil production peaked at 12.5 million barrels per day in 1987, but the revenue surge of the 1970s allowed the regime to postpone reforms in agriculture, manufacturing, and technology. When prices collapsed in 1986 — from $27 per barrel in 1985 to below $10 by mid-1986 — the Soviet budget lost a critical revenue stream. Oil and gas accounted for roughly 60% of Soviet hard-currency export earnings by the mid-1980s. The price decline reduced those earnings by an estimated $20 billion annually, a sum equivalent to about 4% of Soviet GDP.
Venezuela’s oil dependence was even more extreme. By 1973, oil already accounted for over 90% of the country’s export revenue. The 1970s price boom financed an expansion of the state apparatus and social programs, but it also entrenched a pattern of fiscal procyclicality: when prices rose, spending rose; when prices fell, the state borrowed rather than cut. The pattern repeated across multiple cycles — 1986, 1998, 2008, 2014 — each time with diminishing capacity to recover.
What the data shows
The transmission of oil price shocks into macroeconomic outcomes can be tracked through a set of specific indicators: real GDP growth, CPI inflation, the current account balance, and the fiscal breakeven oil price for petrostates. The table below compares the impact of the 1973 shock on three major importers and the 2014 shock on three major exporters.
| Country | Shock year | Real GDP growth (year prior) | Real GDP growth (shock year) | CPI inflation (shock year) | Current account balance (% of GDP, shock year) |
|---|---|---|---|---|---|
| United States | 1974 | 5.6% (1973) | -0.5% | 11.0% | 0.2% |
| United Kingdom | 1974 | 7.2% (1973) | -1.3% | 16.0% | -4.2% |
| Japan | 1974 | 8.0% (1973) | -1.2% | 23.2% | -1.0% |
| Russia | 2015 | 0.7% (2014) | -2.0% | 15.5% | 5.0% |
| Venezuela | 2015 | -3.9% (2014) | -6.2% | 121.7% | -7.1% |
| Saudi Arabia | 2015 | 3.7% (2014) | 4.1% | 2.2% | -8.7% |
Sources: World Bank (GDP, inflation, current account); IMF (Venezuela inflation 2015); BP Statistical Review (oil prices).
The 1973 shock produced synchronous recessions in the three largest advanced economies — the only time in the postwar period that the U.S., U.K., and Japan all contracted in the same year. Inflation surged to double digits in all three, with Japan’s 23.2% rate reflecting both the direct oil cost and the pass-through of yen depreciation after the collapse of Bretton Woods.
For the 2014–2015 shock, the data reveals the asymmetric impact on exporters. Russia’s GDP contracted by 2.0% in 2015, but the current account remained in surplus — a reflection of the ruble float, which acted as a shock absorber by reducing import demand. Venezuela’s contraction was deeper and its inflation exploded, reflecting a refusal to adjust the exchange rate. Saudi Arabia’s GDP actually grew in 2015, but the current account swung from a surplus of 9.8% of GDP in 2014 to a deficit of 8.7% in 2015 — a swing of 18.5 percentage points in a single year.
The fiscal breakeven price — the oil price required to balance the government budget — is a critical metric for petrostates. In 2014, the IMF estimated Saudi Arabia’s breakeven price at roughly $100 per barrel, Russia’s at $105, and Venezuela’s at $120. When Brent crude averaged $53 per barrel in 2015, all three were running fiscal deficits. Saudi Arabia financed its deficit through sovereign wealth fund drawdowns and debt issuance; Russia allowed the ruble to float; Venezuela printed money, triggering hyperinflation.
Country-level comparison
The three petrostate trajectories — Russia, Venezuela, and Saudi Arabia — illustrate how identical price shocks produce divergent outcomes depending on institutional capacity, exchange rate policy, and the size of fiscal buffers.
Russia: From collapse to managed float. The 1986 oil price decline was a contributing factor in the Soviet Union’s dissolution, but it was not the sole cause. The revenue loss accelerated a fiscal crisis that had been building since the late 1970s, when declining productivity growth and rising military expenditure created structural deficits. By 1989, the Soviet budget deficit had reached 9% of GDP. The oil windfall of the 1970s had masked these imbalances; the 1986 price collapse exposed them.
The post-Soviet period saw a repeat of the pattern. Russia’s oil and gas sector accounted for roughly 50% of federal budget revenue by the early 2000s. The 2008 price crash — from $145 per barrel in July 2008 to $36 in December — triggered a 7.8% GDP contraction in 2009. Russia responded by allowing the ruble to depreciate gradually and by drawing on the Reserve Fund, which had been built up during the 2000s boom. The 2014–2015 shock was more severe because it coincided with Western sanctions following the annexation of Crimea. The central bank abandoned its managed float in November 2014, allowing the ruble to fall freely. By January 2015, the ruble had lost 46% of its value against the dollar. Inflation peaked at 15.5% in 2015, but the current account remained in surplus — the ruble depreciation boosted non-oil exports and compressed imports. Russia’s fiscal rule, adopted in 2017, now requires that oil revenue above a cutoff price ($40 per barrel for Urals crude) be directed to the National Welfare Fund, creating a buffer against future shocks.
Venezuela: The collapse of a petrostate. Venezuela’s trajectory is the most extreme example of oil shock transmission in the modern era. Oil accounted for 95% of export revenue and roughly 50% of fiscal revenue by 2013. The 2014–2015 price collapse reduced export earnings from $95 billion in 2013 to $33 billion in 2016. The government refused to adjust the exchange rate — the official rate was fixed at 6.3 bolivars per dollar from 2013 to 2018 — creating a massive black market premium that reached 99% by 2016.
The fiscal response was monetary financing. The central bank printed bolivars to cover the deficit, producing hyperinflation. The IMF estimates that Venezuela’s cumulative inflation between 2014 and 2019 exceeded 5,000,000%. Real GDP contracted by roughly 50% over the same period — a decline comparable to that of Zimbabwe in the 2000s or the Soviet Union in the early 1990s. The collapse was not purely an oil shock; it was compounded by policy errors, including price controls, expropriations, and the breakdown of the electricity grid. But the oil shock was the trigger: without the revenue collapse, the regime would have had the fiscal space to maintain subsidies and avoid the extreme monetary expansion that destroyed the currency.
Saudi Arabia: Buffers and diversification. Saudi Arabia’s response to the 2014–2015 shock differed from Russia’s and Venezuela’s in two respects. First, the kingdom had accumulated substantial fiscal buffers during the 2000s boom. The Saudi Arabian Monetary Authority’s net foreign assets peaked at $737 billion in August 2014. Second, Saudi Arabia had the institutional capacity to issue debt — the government raised $17.5 billion in its first international bond sale in 2016 — and to draw on the Public Investment Fund (PIF), which had been capitalized with oil revenue.
The fiscal breakeven price for Saudi Arabia was estimated at $100 per barrel in 2014, but the kingdom ran deficits of 15.8% of GDP in 2015 and 17.2% in 2016 without triggering a currency crisis. The riyal remained pegged to the U.S. dollar at 3.75 per dollar throughout the period. The cost was a drawdown of foreign reserves — net foreign assets fell to $486 billion by the end of 2016 — and the introduction of fiscal reforms, including the 2015 reduction of fuel subsidies and the 2018 introduction of a 5% value-added tax.
Vision 2030, announced in 2016, aims to reduce Saudi Arabia’s dependence on oil by developing non-oil revenue sources, including tourism, entertainment, and manufacturing. The PIF’s assets grew from roughly $200 billion in 2015 to over $600 billion by 2023, making it one of the largest sovereign wealth funds in the world. But oil still accounted for 62% of fiscal revenue in 2022, and the non-oil economy remains heavily dependent on government spending funded by oil revenue. The diversification attempt is real, but it is a generational project, not a short-term adjustment.
The political-economic mechanism
The transmission of oil shocks in petrostates operates through a mechanism that is distinct from the one that operates in importing economies. For importers, the shock is a terms-of-trade deterioration that reduces real income and raises production costs. For exporters, the shock is a fiscal collapse that propagates through the government budget, the exchange rate, and the financial system.
The fiscal channel is the primary transmission mechanism. In petrostates, oil revenue typically accounts for 40–60% of government revenue and 80–95% of export earnings. When the oil price falls, the government faces an immediate revenue shortfall. Because oil revenue accrues to the state — either through state-owned oil companies (PDVSA in Venezuela, Saudi Aramco in Saudi Arabia) or through taxes and royalties — the private sector does not have a direct claim on the revenue stream. The government is the intermediary. When oil revenue declines, the government must either cut spending, draw down reserves, borrow, or print money.
The choice among these options determines the macroeconomic outcome. Cutting spending reduces aggregate demand, deepening the recession. Drawing down reserves provides a temporary buffer but depletes the stock of foreign assets. Borrowing is possible only if the government has access to international capital markets — Venezuela lost that access after 2014, while Saudi Arabia retained it. Printing money, the option chosen by Venezuela, produces inflation or hyperinflation.
The exchange rate channel amplifies the fiscal channel. Petrostates typically maintain fixed or managed exchange rates to anchor inflation and facilitate trade. When oil revenue collapses, the fixed rate becomes unsustainable because the current account deteriorates and foreign reserves decline. The resulting devaluation raises the domestic-currency cost of imports, fueling inflation. In Venezuela, the refusal to devalue created a black market premium that distorted all relative prices and encouraged capital flight. In Russia, the decision to float the ruble allowed the exchange rate to act as a shock absorber — the ruble depreciated by 46%, but the current account remained in surplus and inflation, while high, did not spiral into hyperinflation.
The monetary channel is the third transmission mechanism. In petrostates, the central bank’s ability to conduct independent monetary policy is constrained by the exchange rate regime and the fiscal dominance of oil revenue. When the government prints money to cover the deficit, the central bank loses control of the money supply. In Venezuela, the monetary base expanded by over 1,000% per year between 2016 and 2019, producing hyperinflation. In Russia, the central bank maintained its independence by allowing the ruble to float and by targeting inflation rather than the exchange rate. The result was a sharp but contained inflation spike.
The political channel is the final layer. Oil revenue allows petrostates to maintain low taxes, high subsidies, and large public sectors. When revenue collapses, the government must either reduce subsidies, cut public employment, or raise taxes — all of which are politically costly. The 2014–2015 shock forced Saudi Arabia to reduce fuel subsidies for the first time in decades. Russia cut real wages in the public sector. Venezuela tried to maintain subsidies through monetary financing, which destroyed the currency and produced a humanitarian crisis. The political response to the fiscal shock determines whether the adjustment is orderly or chaotic.
Why it matters today
The mechanism described above is not historical. As of 2025, the global oil market remains vulnerable to supply disruptions and price spikes. The International Energy Agency estimates that upstream oil investment in 2024 was roughly 25% below the 2015 peak in real terms, suggesting that spare production capacity is limited. A geopolitical shock, such as a conflict in the Strait of Hormuz, a disruption to Russian exports, or a production cut by OPEC+, could produce a price spike comparable to 1973 or 2008.
For importing economies, the transmission mechanism has changed since 1973. The U.S. is now a net oil exporter, having become the world’s largest crude producer in 2018. The European Union and Japan remain import-dependent, but their energy intensity has declined — the EU uses roughly 40% less oil per unit of GDP than in 1973. The risk of a 1970s-style stagflation is lower, but not zero. The 2022 spike — Brent crude reached $128 per barrel in March 2022 following Russia’s invasion of Ukraine — produced inflation of 9.1% in the U.S. and 10.6% in the euro area, though central banks responded with aggressive rate hikes rather than accommodation.
For petrostates, the stakes are higher. Russia’s fiscal rule and ruble float provide a buffer, but the country remains dependent on oil and gas for roughly 30% of GDP. Saudi Arabia’s Vision 2030 has reduced the non-oil economy’s dependence on government spending, but oil still accounts for the majority of fiscal revenue. Venezuela’s collapse is a cautionary tale: a petrostate that refuses to adjust its exchange rate, maintain fiscal discipline, or diversify its economy can lose half its GDP in five years.
The data from the three case studies suggests a clear pattern. Oil shocks do not merely raise or lower prices; they rewire the fiscal politics, exchange rate regimes, and monetary policies of affected countries for a decade or more. The 1973 shock ended the Bretton Woods system’s last vestiges and produced a decade of stagflation. The 1986 shock contributed to the Soviet Union’s dissolution. The 2014–2015 shock forced Russia to float the ruble, destroyed Venezuela’s economy, and pushed Saudi Arabia toward diversification. The next shock (and there will be a next shock) will produce similar structural changes, though the specific outcomes will depend on the institutional capacity and policy choices of the affected states.
Data notes
- Real GDP growth: World Bank, World Development Indicators (1960-2023).
- CPI inflation: World Bank, World Development Indicators; IMF, International Financial Statistics (Venezuela 2015-2019).
- Current account balance (% of GDP): World Bank, World Development Indicators; IMF, Balance of Payments Statistics.
- Oil prices: BP Statistical Review of World Energy (annual, 1972-2023); EIA Short-Term Energy Outlook (2024).
- Fiscal breakeven oil prices: IMF, Article IV consultations (Russia 2014, Saudi Arabia 2014, Venezuela 2014).
- Russia oil and gas share of budget revenue: Russian Ministry of Finance, annual budget execution reports.
- Saudi Arabia net foreign assets: Saudi Central Bank (SAMA), monthly statistical bulletin.
- Venezuela export revenue: IMF, Article IV — Venezuela (2018); World Bank, Fuel exports (% of merchandise exports).
- Sovereign wealth fund assets: Sovereign Wealth Fund Institute (SWFI), annual rankings.
- U.S. oil production: EIA, Annual Energy Outlook.
Frequently asked questions
What caused the 1973 oil crisis and how did it affect the global economy?
How did the 1986 oil price collapse contribute to the Soviet Union's collapse?
Why did Venezuela's economy collapse so much worse than Russia's after 2014?
How does Saudi Arabia manage oil price volatility differently from other petrostates?
What is the fiscal breakeven oil price and why does it matter?
Sources
- BP/EI Statistical Review of World Energy (annual)
- IMF Article IV — Venezuela (last published 2018 before suspension)
- Hamilton, J. (2009), 'Causes and Consequences of the Oil Shock of 2007-08' — Brookings Papers on Economic Activity 1: 215-261.
- World Bank, Fuel exports (% of merchandise exports)
- EIA, Short-Term Energy Outlook