The Rise and Fall of Export-Led Growth: Germany, China, Japan and the Limits of Surplus Economies
A current account surplus is one country's claim on another. When too many large economies run them at once, the system pushes back.
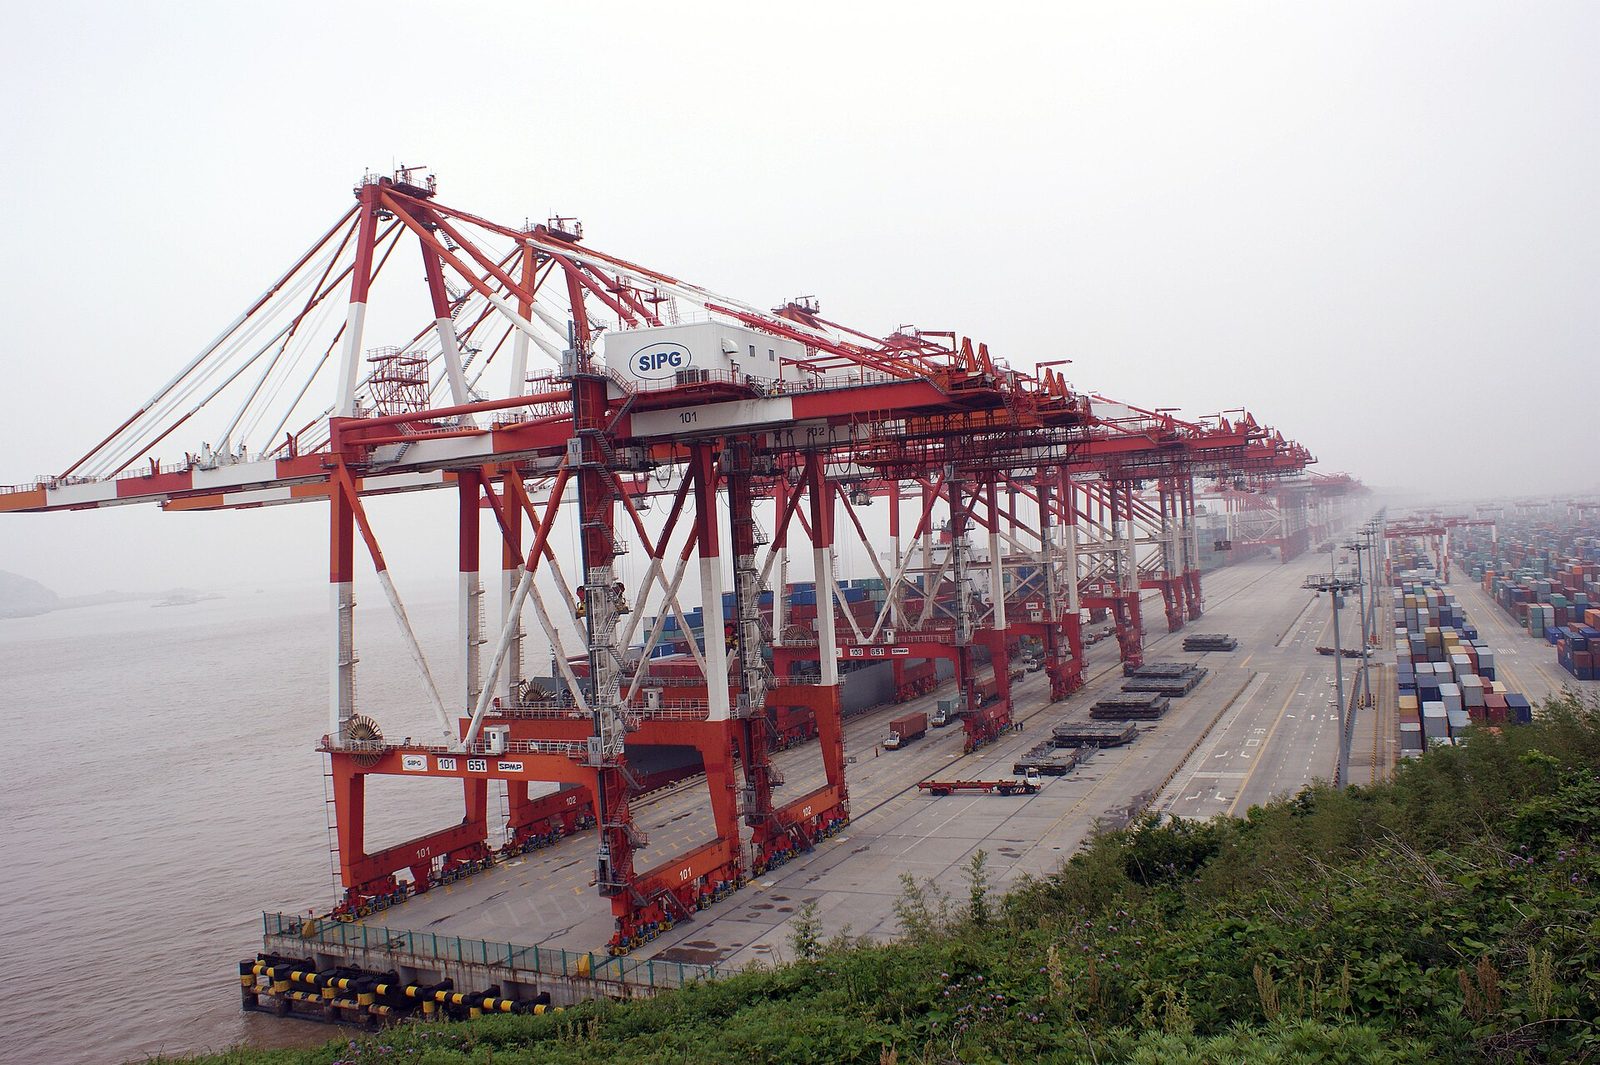
The post-war economic order rewarded nations that exported more than they imported. Japan, South Korea, Taiwan, Germany, and later China each built their modern industrial states on a strategy of persistent current account surpluses, accumulating claims on the rest of the world. Yet this model contains an inherent mathematical contradiction: not every economy can run a surplus simultaneously. The system requires a deficit counterpart, and for over three decades the United States played that role. The 2008 global financial crisis exposed the fragility of this arrangement, and the political backlash of the 2010s and 2020s — from Trump-era tariffs to the Inflation Reduction Act and the EU’s Carbon Border Adjustment Mechanism — made clear that the era of unfettered export-led growth is ending. The question is not whether surplus economies will adapt, but which ones can do so without breaking their domestic social contracts.
Key takeaways
- Japan’s current account surplus averaged 2.5% of GDP from 1980 to 2020, peaking at 4.9% in 1986, before the Plaza Accord forced yen appreciation.
- Germany’s surplus reached 8.6% of GDP in 2015, the largest of any major economy in the post-Bretton Woods era, according to the IMF World Economic Outlook.
- China’s surplus peaked at 9.9% of GDP in 2007, then fell to roughly 1.5% by 2022, reflecting a partial rebalancing toward domestic consumption.
- The United States ran a cumulative current account deficit of over $14 trillion between 1990 and 2023, absorbing the surplus savings of Germany, China, and Japan.
- The Eurozone’s internal imbalances remain structural: Germany’s surplus within the currency bloc was 7.1% of Eurozone GDP in 2022, while Southern Europe ran persistent deficits.
- The 2018-2019 US tariffs on Chinese goods reduced the bilateral trade deficit by only 0.3% of GDP, suggesting tariffs alone cannot resolve global imbalances.
Historical setup
Export-led growth as a deliberate state strategy emerged in the 1950s, when Japan’s Ministry of International Trade and Industry (MITI) orchestrated a shift from import substitution to export promotion. The logic was straightforward: a small, resource-poor nation could earn foreign exchange by manufacturing goods for global markets, then reinvest those earnings into higher-value industries. Japan’s GDP per capita grew at an average of 8.1% annually from 1955 to 1973, a period during which its current account moved from deficit to persistent surplus.
South Korea and Taiwan adopted similar models in the 1960s, with state-directed credit allocation, protected domestic markets, and aggressive export subsidies. By the 1980s, both economies had transformed from agrarian to industrial exporters. South Korea’s current account swung from a deficit of 8.2% of GDP in 1980 to a surplus of 7.6% by 1987.
Germany’s path was different. West Germany emerged from World War II with an industrial base intact and a currency deliberately undervalued within the Bretton Woods system. After the collapse of fixed exchange rates in 1971, Germany’s surplus persisted not through currency manipulation but through structural competitiveness: high productivity growth, wage restraint, and a manufacturing sector that specialized in capital goods. By the 1980s, Germany’s surplus had become a permanent feature of the European economy.
China’s entry into this system came later. After joining the World Trade Organization in 2001, China’s current account surplus expanded rapidly, from 1.3% of GDP in 2001 to a peak of 9.9% in 2007. The mechanism was the same as Japan’s in the 1960s: an undervalued exchange rate, repressed domestic consumption, and massive state-directed investment in export industries. The difference was scale. China’s surplus in 2007 was $371 billion, larger than Japan’s peak surplus of $87 billion (in nominal terms) in 1986.
What the data shows
The persistence of surpluses across these four economies is notable. The table below shows average current account balances as a share of GDP for each decade since 1980.
| Decade | Japan | Germany | China | South Korea |
|---|---|---|---|---|
| 1980-1989 | 2.3% | 1.8% | -0.5% | 0.2% |
| 1990-1999 | 2.6% | -0.5% | 1.2% | 1.3% |
| 2000-2009 | 3.1% | 4.2% | 4.5% | 2.8% |
| 2010-2019 | 2.9% | 7.1% | 2.6% | 5.7% |
Source: IMF World Economic Outlook database, April 2024.
The data reveals two important patterns. First, Germany’s surplus accelerated after the creation of the euro, rising from an average of 1.8% in the 1980s to 7.1% in the 2010s. The single currency eliminated exchange rate risk within Europe, making German exports cheaper for Eurozone partners while preventing those partners from devaluing their own currencies. Second, China’s surplus declined sharply after 2007, falling to an average of 1.5% between 2015 and 2023. This was not accidental — Beijing began a deliberate rebalancing toward domestic consumption after the 2008 crisis, though the process remains incomplete.
The counterpart to these surpluses was the US current account deficit, which averaged 3.5% of GDP from 2000 to 2019 and peaked at 6.0% in 2006. As Federal Reserve Chairman Ben Bernanke argued in his 2005 “global saving glut” speech, the US deficit was not a sign of American profligacy but a reflection of excess savings in surplus economies. The United States was the buyer of last resort.
Country-level comparison
Japan offers the clearest cautionary tale. By the late 1980s, Japan’s export-led model had created enormous external surpluses and domestic asset bubbles. The Plaza Accord of 1985 forced the yen to appreciate by 50% against the dollar over two years. Japan’s export competitiveness suffered, but the surplus persisted because Japanese firms shifted production overseas and repatriated profits. The real cost was domestic: the Bank of Japan’s attempt to manage the yen’s rise through loose monetary policy fueled a stock and real estate bubble that, when it burst in 1990, produced two decades of deflation and stagnation. Japan’s GDP per capita in 2023 was roughly the same in real terms as it was in 1995.
Germany avoided Japan’s fate, but for reasons that may not be replicable. German reunification in 1990 temporarily pushed the current account into deficit, but the euro’s creation in 1999 gave Germany a structural advantage. Within the Eurozone, Germany’s surplus was not a bilateral imbalance with the United States but a multilateral imbalance with countries like Greece, Spain, and Italy. These countries could not devalue their currencies because they shared the euro. Germany’s wage restraint (real wages grew only 0.3% annually from 2000 to 2010) suppressed domestic demand while boosting export competitiveness. The result was a surplus that reached 8.6% of GDP in 2015, a level the IMF has repeatedly called “excessive.”
China’s trajectory is different from both Japan and Germany. After peaking at 9.9% of GDP in 2007, China’s surplus contracted to 1.5% by 2022. This was partly due to policy (Beijing raised the value of the renminbi by 20% between 2005 and 2014, expanded social welfare programs to reduce precautionary saving, and encouraged domestic consumption). But it was also due to structural shifts: rising labor costs, an aging population, and the transition from investment-led to consumption-led growth. China’s GDP per capita crossed $12,000 in 2019, entering the World Bank’s “upper-middle income” category, a level at which export-led growth typically gives way to domestic demand.
South Korea offers a middle path. Its surplus has averaged 5.7% of GDP since 2010, but it has avoided the extreme imbalances of Germany or Japan. South Korea’s chaebol (Samsung, Hyundai, LG) have diversified into high-value exports like semiconductors and electric vehicles, maintaining competitiveness without requiring the same degree of wage suppression seen in Germany. The result is a surplus that is large but not destabilizing.
The political-economic mechanism
The persistence of large current account surpluses is not a market outcome but a political choice. Export-led growth requires three conditions: an undervalued exchange rate, suppressed domestic consumption, and a willingness to accumulate foreign assets. Each of these conditions creates domestic winners and losers.
An undervalued exchange rate benefits export industries and their workers but raises the cost of imports, effectively taxing consumers. In Germany, this tax has been borne by households: the share of private consumption in GDP fell from 58% in 2000 to 50% in 2022, one of the lowest rates in the developed world. In China, the same dynamic produced a consumption share of just 38% of GDP in 2010, compared to 68% in the United States.
Suppressed domestic consumption is achieved through wage restraint, limited social safety nets, and financial repression. German labor unions accepted real wage stagnation in the 2000s as part of the Hartz reforms, which reduced unemployment benefits and made the labor market more flexible. Chinese households saved an average of 30% of their disposable income in the 2000s, partly because the state provided minimal pensions, healthcare, and education.
The accumulation of foreign assets (primarily US Treasury bonds, German Bunds, and Chinese sovereign wealth funds) represents a transfer of real resources from the surplus economy to the deficit economy. As Michael Pettis argued in The Great Rebalancing (2013), a current account surplus is effectively a subsidy from domestic workers to foreign consumers. The surplus economy exports goods today in exchange for claims on future output, but those claims may never be fully redeemed.
The political mechanism breaks down when the deficit economy reaches its borrowing limit. The United States, as the issuer of the world’s reserve currency, can run deficits indefinitely, but the political tolerance for doing so has limits. The 2008 crisis was triggered by a collapse in US housing prices, but the underlying cause was a global savings glut that pushed capital into US mortgage-backed securities. The 2018-2019 US-China trade war was a direct response to China’s surplus, with tariffs targeting precisely the export industries that had driven China’s growth.
Why it matters today
The era of export-led growth is ending, but the transition is uneven. China has rebalanced more than any other surplus economy, but its current account surplus has begun to rise again, reaching 2.2% of GDP in 2023 as domestic demand weakened. Germany shows no sign of rebalancing: its surplus was 7.0% of GDP in 2023, driven by energy price shocks and a manufacturing sector that remains globally competitive despite the Ukraine war.
The political response is accelerating. The US Inflation Reduction Act and CHIPS Act of 2022 are explicitly designed to reshore manufacturing and reduce dependence on surplus economies. The EU’s Carbon Border Adjustment Mechanism, set to phase in fully by 2026, will impose costs on imports from countries with weaker climate policies — a de facto tariff on surplus economies like China. Japan, after decades of stagnation, has abandoned its export-led model by default, with its current account surplus now driven by investment income rather than trade.
The structural problem remains: the world economy cannot run on surpluses alone. If every major economy tries to export its way to growth, the system produces deflationary pressure, asset bubbles, and political backlash. The surplus economies that survive the transition will be those that shift toward domestic demand, rebuild social safety nets, and accept that a current account surplus is not an unqualified good. The ones that do not will face the same fate as Japan: a long stagnation masked by a persistent surplus.
Data notes
- Current account balance as a share of GDP: IMF World Economic Outlook database (April 2024 edition), series BCA_NGDPD. Data covers 1980-2023 for all countries cited.
- US current account deficit: Bureau of Economic Analysis, International Transactions data (Table 1), annual series 1990-2023.
- German wage growth: German Federal Statistical Office (Destatis), real wage index, 2000-2010.
- Chinese household savings rate: World Bank, Gross savings (% of GDP), series NY.GNS.ICTR.ZS, 2000-2010.
- South Korean current account: Bank of Korea, Economic Statistics System, annual series 1980-2023.
- Plaza Accord and yen appreciation: Bank for International Settlements, historical exchange rate data, 1985-1987.
Frequently asked questions
What is export-led growth and why did it become a dominant strategy?
Why can't all countries run a current account surplus at the same time?
How did Germany maintain such a large surplus within the Eurozone?
Did China's export-led model succeed or fail in the long run?
What does the end of export-led growth mean for global trade?
Sources
- IMF World Economic Outlook database — Current Account series
- World Bank, Current account balance (% of GDP)
- Bernanke (2005), 'The Global Saving Glut and the U.S. Current Account Deficit' — Sandridge Lecture, Virginia Association of Economists.
- Pettis (2013), The Great Rebalancing — Princeton University Press.
- BIS Annual Economic Report (annual) — global imbalances chapter