The 1970s Inflation Crisis and What It Actually Teaches About the 2020s
The two episodes share a number on the CPI release but almost nothing else. Mistaking them costs central banks credibility.
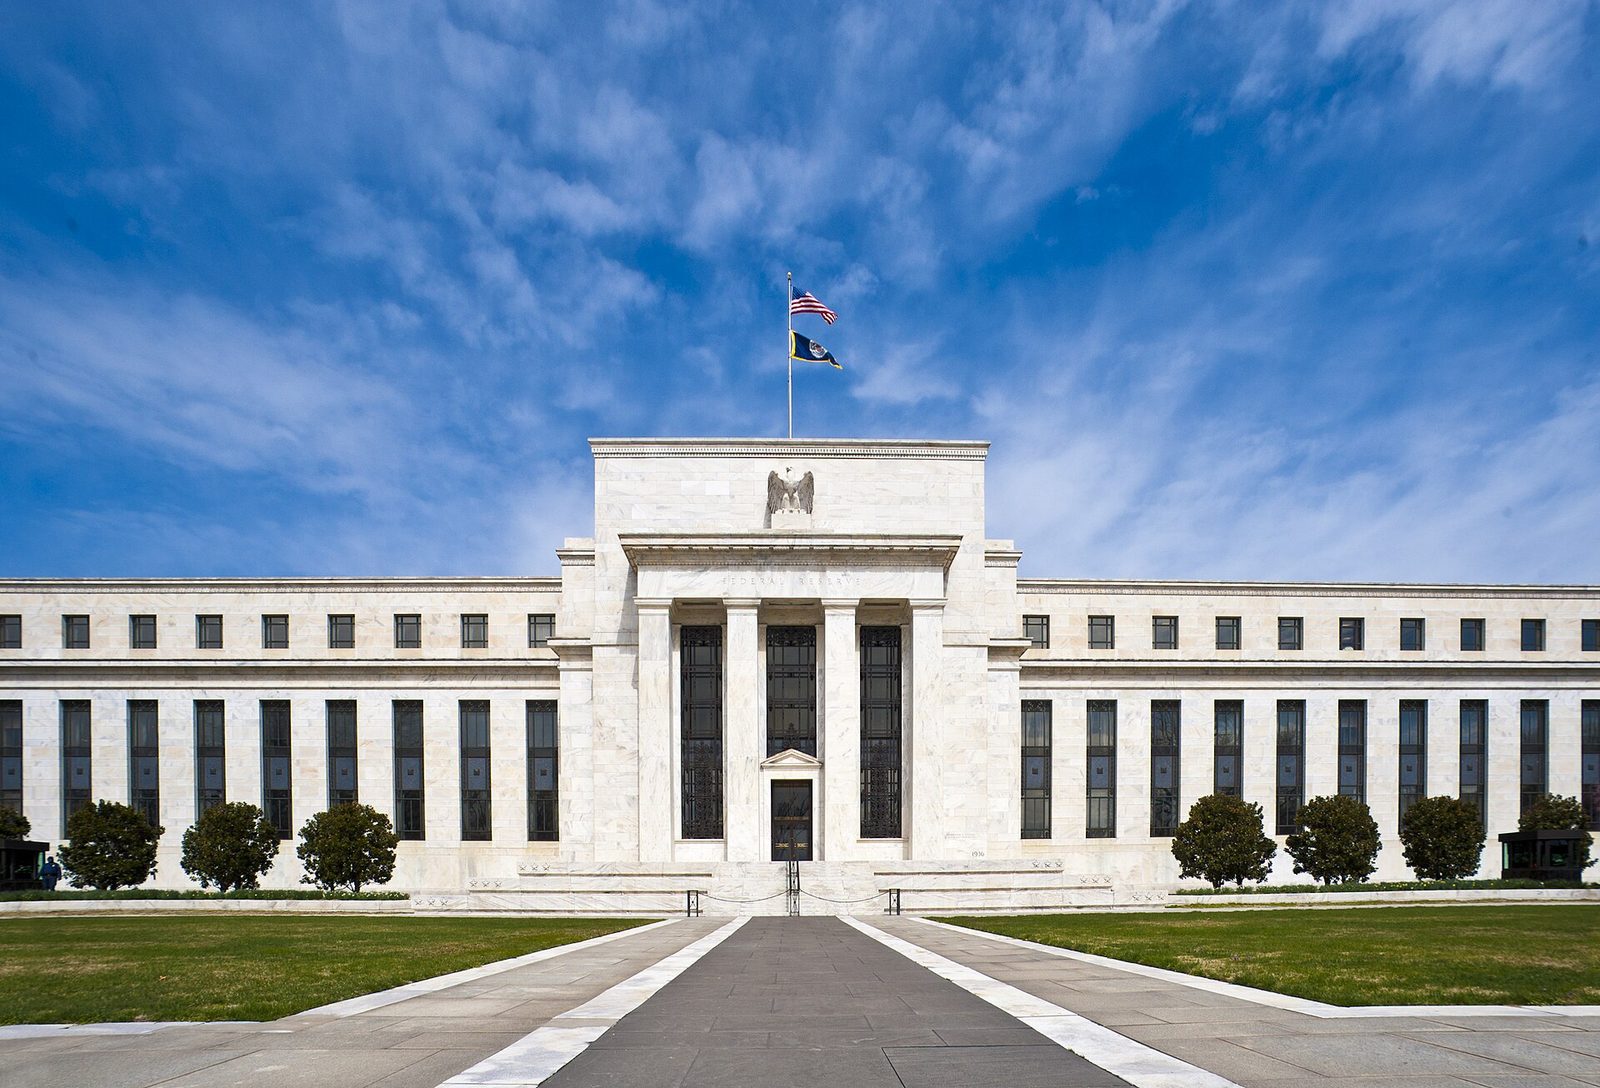
The 1970s inflation crisis and the 2020s inflation episode share a headline number—double-digit CPI readings—but diverge sharply in cause, persistence, and resolution. The 1970s shock was a supply-driven spiral (the 1973 oil embargo quadrupled crude prices, the 1979 Iranian Revolution doubled them again) layered onto already-loose monetary conditions under Arthur Burns’s Federal Reserve, which accommodated Nixon’s re-election politics. US CPI peaked at 14.8% in March 1980. Paul Volcker broke it by raising the federal funds rate to 19% in 1981, accepting an 11% unemployment recession. The 2020s episode was different: pandemic supply chain disruption, a war-driven energy spike (Russia-Ukraine 2022), and massive fiscal stimulus drawdown. US CPI peaked at 9.1% in June 2022 and fell to roughly 3% by 2024 without a deep recession. The lesson is not that the Volcker recipe always works; it is that fast inflations and slow inflations have different drivers. The risk now is the slow-erosion pattern: stickiness around 3–4% rather than runaway.
Key takeaways
- US CPI peaked at 14.8% in March 1980 during the 1970s crisis, versus 9.1% in June 2022 in the 2020s episode.
- The 1973 oil embargo quadrupled crude prices; the 1979 Iranian Revolution doubled them again, creating a supply-driven shock.
- Arthur Burns’s Fed kept monetary policy too loose through the early 1970s, accommodating fiscal expansion and wage-price controls.
- Volcker raised the federal funds rate to 19% in 1981, triggering an 11% unemployment recession to break inflation expectations.
- The 2020s inflation was driven by pandemic supply chain disruption, war-driven energy spikes, and fiscal stimulus drawdown, not wage-price spirals.
- Core inflation in the US fell from 6.6% (September 2022) to roughly 3% by mid-2024 without a deep recession, suggesting different underlying dynamics.
Historical setup
The 1970s inflation crisis did not emerge from a single event but from a decade-long accumulation of policy errors and external shocks. By the late 1960s, the US economy was running hot: unemployment averaged 3.5% from 1966 to 1969, and the Vietnam War-era fiscal expansion pushed the budget deficit to 2.9% of GDP by 1968. The Federal Reserve under William McChesney Martin began tightening in 1969, but the recession of 1970 was mild, and inflation only briefly dipped below 4%.
The structural break came in 1971. President Nixon imposed wage and price controls in August 1971, temporarily suppressing inflation but creating distortions in energy and agricultural markets. The controls were phased out by 1973, releasing pent-up price pressures just as the Arab oil embargo hit. The Organization of Arab Petroleum Exporting Countries (OAPEC) cut production and embargoed the US and its allies in October 1973, quadrupling the price of crude from roughly $3 to $12 per barrel within months. US CPI, which had been running at 3.3% in 1972, surged to 11.0% by the end of 1974.
Monetary policy under Arthur Burns compounded the problem. Burns, appointed by Nixon in 1970, kept the federal funds rate below the inflation rate for much of the early 1970s—real interest rates were negative. The Fed’s own internal records, later published, show Burns was acutely aware of political pressure from the White House to keep rates low ahead of the 1972 election. The result was a monetary base that expanded by 8.5% per year from 1970 to 1973, fueling demand at precisely the moment supply was contracting.
The second oil shock of 1979—triggered by the Iranian Revolution, which cut Iran’s oil output from 5.5 million barrels per day in 1978 to under 1 million by early 1979—doubled crude prices again, from $13 to $34 per barrel. By then, inflation expectations had become entrenched. Surveys from the University of Michigan show that households expected inflation of 10% or more for the next year by late 1979. The wage-price spiral was real: union contracts included cost-of-living adjustments (COLAs) that automatically raised wages with CPI, locking in the inflation.
What the data shows
The data reveals two distinct inflation profiles. The 1970s episode was longer, higher, and more persistent. The 2020s episode was shorter, lower, and more responsive to monetary tightening.
| Indicator | 1970s Peak | 2020s Peak |
|---|---|---|
| US CPI (year-over-year) | 14.8% (March 1980) | 9.1% (June 2022) |
| Core CPI (excluding food & energy) | 13.6% (June 1980) | 6.6% (September 2022) |
| Federal funds rate (peak) | 19.0% (June 1981) | 5.5% (July 2023) |
| Unemployment rate (peak after tightening) | 10.8% (November 1982) | 3.7% (January 2024) |
| Duration CPI above 5% | 68 months (Feb 1973–Oct 1978; Jan 1979–Nov 1982) | 24 months (Feb 2021–Jan 2023) |
| Real GDP growth (year of peak CPI) | -0.3% (1980) | +1.9% (2022) |
Sources: FRED data for CPI and federal funds rate; Bureau of Labor Statistics for unemployment; Bureau of Economic Analysis for GDP.
The persistence difference is pronounced. In the 1970s, inflation stayed above 5% for nearly six years across two separate episodes. In the 2020s, it stayed above 5% for only two years. The unemployment cost of disinflation was also dramatically different: Volcker’s tightening pushed unemployment above 10% for ten months; the 2022–2024 tightening saw unemployment never exceed 4.0%.
The composition of inflation also differed. In the 1970s, energy and food price shocks were the initial triggers, but they quickly fed into core inflation through wage-price spirals. In the 2020s, energy and food prices spiked in 2022 but then fell back; core inflation was driven more by goods prices (supply chain bottlenecks) and, later, by shelter costs. By 2024, shelter inflation was the main component keeping core CPI elevated, and it was responding to lagged rent increases rather than a wage-price spiral.
Country-level comparison
The 1970s inflation was a global phenomenon, but the 2020s episode showed even greater variation across countries. In the 1970s, most advanced economies experienced double-digit inflation: the UK peaked at 27% in 1975 (after the oil shock), Japan at 24% in 1974, and Germany at 7% (the outlier, thanks to the Bundesbank’s early tightening). The common thread was the oil price shock combined with accommodative monetary policy.
In the 2020s, the range was narrower but still significant. The US peaked at 9.1%, the euro area at 10.6% (October 2022), the UK at 11.1% (October 2022), and Japan at 4.3% (January 2023). The differences reflected exposure to energy imports, fiscal policy choices, and labor market structures. The euro area, heavily dependent on Russian gas, saw energy inflation hit 41% at its peak in 2022. The UK’s combination of Brexit-related trade frictions and a tight labor market pushed inflation higher for longer.
A key divergence was in the labor market. In the 1970s, wage-price spirals were widespread because unions had bargaining power and COLAs were common. In the 2020s, union density had fallen (from 23% in the US in 1973 to 10% in 2023), and COLAs were rare. Wage growth did pick up—US average hourly earnings rose 5.5% year-over-year in early 2023—but it did not keep pace with inflation, and productivity growth was stronger. Real wages actually fell in many economies, dampening the second-round effects.
Another difference was the role of fiscal policy. In the 1970s, fiscal expansion was modest relative to GDP. In the 2020s, the US fiscal response to the pandemic was enormous: the CARES Act (March 2020), the Consolidated Appropriations Act (December 2020), and the American Rescue Plan (March 2021) together totaled roughly $5 trillion, or 25% of GDP. This fiscal stimulus boosted demand at a time when supply was constrained, contributing to the inflation spike. The IMF’s April 2024 World Economic Outlook estimated that fiscal support accounted for about 2 percentage points of the 2021–2022 inflation in advanced economies.
The political-economic mechanism
The mechanism driving the 1970s inflation was a feedback loop between supply shocks, loose monetary policy, and entrenched expectations. The oil shocks were exogenous, but their persistence was endogenous: because the Fed under Burns did not raise rates enough to offset the demand effects, the price increases became embedded in wages and expectations. Once households and firms expected 10% inflation, they acted in ways that made it self-fulfilling—demanding higher wages, raising prices preemptively, and reducing real money balances.
Volcker broke this loop by making a credible commitment to disinflation. The 19% federal funds rate in 1981 was not just a high number; it was a signal that the Fed would tolerate any recession to bring inflation down. The US GDP per capita growth turned negative in 1980 and 1982, but the credibility gain was permanent. By 1983, inflation expectations had fallen to 4%, and the economy recovered.
The 2020s mechanism was different. The initial shock was also supply-driven—pandemic lockdowns disrupted global supply chains, and the Russia-Ukraine war spiked energy and food prices in 2022. But the monetary response was faster and more aggressive. The Fed under Jerome Powell began raising rates in March 2022, when CPI was 8.5%, and raised by 75 basis points at four consecutive meetings in 2022. The federal funds rate went from near zero to 5.5% in 16 months—a faster tightening cycle than Volcker’s, which took 12 months to go from 10% to 19% but started from a higher base.
Crucially, the 2020s episode did not produce a wage-price spiral. The US unemployment rate stayed below 4% throughout the tightening, which would have been unthinkable in the 1970s. The reason was that labor markets were structurally different: gig economy, remote work, lower unionization, and higher productivity growth (US nonfarm business productivity rose 1.4% per year from 2019 to 2023, versus 0.5% in the 1970s). Firms absorbed higher input costs through margins rather than passing them through to wages.
The Bank for International Settlements, in its 2023 Annual Economic Report, argued that the 2020s disinflation was “unusually costless” because inflation expectations remained anchored. The BIS noted that five-year breakeven inflation rates (a market-based measure of expectations) never exceeded 3% in the US during the 2022 peak, whereas they had reached 8% in 1980. Anchored expectations allowed the Fed to tighten without triggering a recession.
Why it matters today
The danger of mistaking the 2020s for the 1970s is that it leads to policy errors in both directions. If central bankers believe they face a 1970s-style wage-price spiral, they may overtighten, causing unnecessary unemployment and recession. If they believe the 2020s disinflation proves that inflation is always transitory, they may under-tighten, allowing inflation to settle at 3–4% rather than returning to the 2% target.
The current risk is the latter: a slow-erosion pattern where inflation remains stubbornly above target without accelerating. The US core PCE inflation, the Fed’s preferred measure, was at 2.7% in March 2024, down from 5.4% in February 2022 but still above the 2% target. Services inflation, particularly shelter and medical care, has been slow to decline. The IMF’s April 2024 World Economic Outlook projected that advanced economy inflation would average 2.6% in 2024 and 2.0% in 2025, but noted “upside risks” from geopolitical tensions and labor market tightness.
The Volcker era teaches that breaking entrenched expectations requires a deep recession. But the 2020s episode teaches that anchored expectations can allow a soft landing. The policy challenge is to distinguish between the two regimes in real time. The Fed’s own framework—average inflation targeting, adopted in 2020—was designed to allow inflation to run above 2% for a time to make up for past undershoots. That framework is now being tested.
A more subtle lesson is about fiscal-monetary coordination. In the 1970s, fiscal policy was expansionary while monetary policy was initially loose, then tight. In the 2020s, fiscal stimulus was massive but temporary, and monetary tightening was rapid. The combination of fiscal withdrawal (the US fiscal deficit fell from 15% of GDP in 2020 to 6% in 2023) and monetary tightening may explain why inflation fell without a recession. The US government debt to GDP ratio rose from 79% in 2019 to 97% in 2023, but the interest burden remained manageable because rates were low for so long.
The real risk for the 2020s is not a repeat of 1970s-style runaway inflation. It is a prolonged period of above-target inflation that erodes purchasing power slowly, undermines central bank credibility, and forces a later, more painful correction. The BIS has warned that “the final mile of disinflation may be the hardest” because services inflation is sticky and labor markets remain tight. If inflation settles at 3%, the Fed will face a choice: accept it (de facto raising the target) or tighten further (risking recession). That choice is the legacy of the 2020s inflation, and it is a different problem than the one Volcker faced.
Data notes
- US CPI (all urban consumers, seasonally adjusted): FRED series CPIAUCSL, 1970–2024.
- Core CPI (excluding food and energy): FRED series CPILFESL, 1970–2024.
- Federal funds rate (effective): FRED series FEDFUNDS, 1970–2024.
- Unemployment rate: Bureau of Labor Statistics, series LNS14000000, 1970–2024.
- Real GDP growth: Bureau of Economic Analysis, NIPA table 1.1.1, 1970–2024.
- Oil prices: US Energy Information Administration, annual average nominal crude oil prices.
- Inflation expectations: University of Michigan Survey of Consumers, median expected price change over next 12 months.
- Union density: Bureau of Labor Statistics, union membership rate for wage and salary workers.
- Fiscal stimulus estimates: IMF World Economic Outlook (April 2024), Chapter 2.
- BIS analysis: Bank for International Settlements, Annual Economic Report 2023, Chapter 2.
- Core PCE inflation: Bureau of Economic Analysis, series PCEPILFE, 2020–2024.
Frequently asked questions
What caused the 1970s inflation crisis?
How did Volcker stop inflation in the 1980s?
Why did 2020s inflation fall without a deep recession?
Did the 1970s and 2020s inflation have the same causes?
What is the main lesson from the 1970s for today's central bankers?
Sources
- FRED, Consumer Price Index for All Urban Consumers (CPIAUCSL)
- Volcker, P. (2018), Keeping at It — PublicAffairs — Volcker's own account of the 1979-82 disinflation.
- Bernanke (2022), 21st Century Monetary Policy — W. W. Norton.
- Bank for International Settlements, Annual Economic Report 2023
- IMF World Economic Outlook (April 2024) — Chapter 2 on disinflation